Monitoring traffic on a Cisco router interface is crucial for network administrators to ensure optimal performance, diagnose issues, and manage bandwidth effectively. This article provides an in-depth look at the commands used to check incoming and outgoing traffic on Cisco router interfaces.
1. Accessing the Router
Before running any commands, you need to access the Cisco router. This can be done via console access, SSH, or Telnet. Use the following steps to establish a session:
1.1 Console Access
Connect a console cable from your computer to the router’s console port.
1.2 SSH/Telnet Access
Use a terminal emulator (like PuTTY) to connect to the router’s IP address.
ssh username@router_ip
2. Basic Commands to View Interface Traffic
2.1 show interfaces
The show interfaces command provides comprehensive information about each interface, including traffic statistics. To view details for a specific interface, append the interface name (e.g., GigabitEthernet0/1).
Router# show interfaces GigabitEthernet0/1
This command output includes:
- Input packets/bytes
- Output packets/bytes
- Errors, drops, overruns, and other critical stats
2.2 show ip interface brief
For a quick overview of all interfaces, their IP addresses, and status:
Router# show ip interface brief
This command helps identify which interfaces are up or down and their assigned IP addresses.
3. Detailed Traffic Monitoring Commands
3.1 show ip traffic
To view IP traffic statistics, including IP packets received, forwarded, and dropped:
Router# show ip traffic
This command provides a snapshot of IP traffic and error statistics, which can be useful for diagnosing network issues.
3.2 show interfaces counters
This command displays counters for all interfaces, showing the number of packets and bytes transferred:
Router# show interfaces counters
For a specific interface, use:
Router# show interfaces counters GigabitEthernet0/1
3.3 show interfaces stats
For more detailed statistics, including packet sizes and types:
Router# show interfaces stats
Or for a specific interface:
Router# show interfaces stats GigabitEthernet0/1
4. Real-Time Traffic Monitoring
4.1 show interfaces summary
This command provides real-time statistics for all interfaces, including packet rates:
Router# show interfaces summary
4.2 show processes cpu
To monitor the router’s CPU utilization, which can be impacted by traffic loads:
Router# show processes cpu
5. Using SNMP for Traffic Monitoring
SNMP (Simple Network Management Protocol) can be used for more advanced and automated traffic monitoring. Ensure SNMP is configured on the router:
Router(config)# snmp-server community public RO
Router(config)# snmp-server location "Data Center"
Router(config)# snmp-server contact admin@domain.com
You can then use SNMP management tools (like SolarWinds, PRTG, or Nagios) to monitor traffic statistics.
6. NetFlow for Traffic Analysis
NetFlow provides detailed information about IP traffic and is useful for traffic analysis and monitoring.
6.1 Enable NetFlow on the Router
Router(config)# ip flow-export destination <collector-ip> 9996
Router(config)# ip flow-export version 9
Router(config)# interface GigabitEthernet0/1
Router(config-if)# ip flow ingress
Router(config-if)# ip flow egress
6.2 View NetFlow Data
Use a NetFlow collector tool to analyze the traffic data collected.
7. Example: Monitoring Traffic
7.1 Check Interface Statistics
Router# show interfaces GigabitEthernet0/1
7.2 Check IP Traffic
Router# show ip traffic
7.3 Monitor Real-Time Traffic
Router# show interfaces summary
8. Third-Party Open Source Tool: Grafana
Grafana is a powerful open-source tool that can be used to visualize traffic data collected from Cisco routers. Here is a basic guide to set up Grafana for monitoring router traffic:
8.1 Install Grafana
# For Debian/Ubuntu
sudo apt-get install -y software-properties-common
wget -q -O - https://packages.grafana.com/gpg.key | sudo apt-key add -
sudo add-apt-repository "deb https://packages.grafana.com/oss/deb stable main"
sudo apt-get update
sudo apt-get install grafana

# Start the Grafana service
sudo systemctl start grafana-server
sudo systemctl enable grafana-server.service
8.2 Configure Grafana
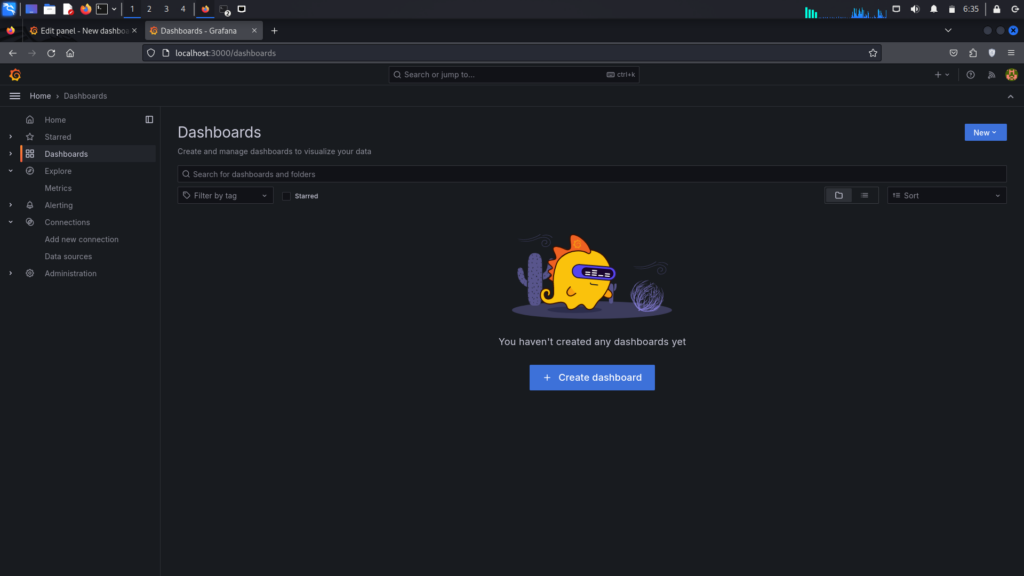
Once Grafana is installed, access the web interface by navigating to http://localhost:3000 in your browser.
Default login credentials:
- Username: admin
- Password: admin
8.3 Set Up Data Source
Configure Grafana to use an SNMP data source (for example, InfluxDB or Prometheus can be used as an intermediary to store SNMP data):
In Grafana:
- Navigate to Configuration > Data Sources
- Add a new data source and select your SNMP database (InfluxDB, Prometheus, etc.)
8.4 Create Dashboards
Create dashboards to visualize the traffic data:
- Navigate to Create > Dashboard
- Add panels for various metrics such as incoming/outgoing traffic, errors, CPU usage, etc.
Grafana allows you to customize the visualizations and create detailed, interactive dashboards that can be shared with your team.
CCNA Classes in Dubai – CCNAGuru (Cisco Expert Trainer)
Join CCNA classes in Dubai by CCNAGuru, led by a Cisco-certified expert. Available for in-person and online classes with real lab practice, exam-focused training, and career guidance.
Introduction to Networks
Switching, Routing & Wireless
Enterprise Networking & Security
CCNA Training Across U.S. States
Explore CCNA Training Centers and Certification Courses across every U.S. state.
Connect with me: FB X IN YT TT WA
*All U.S. state pages are part of CCNAGuru.com's training network.